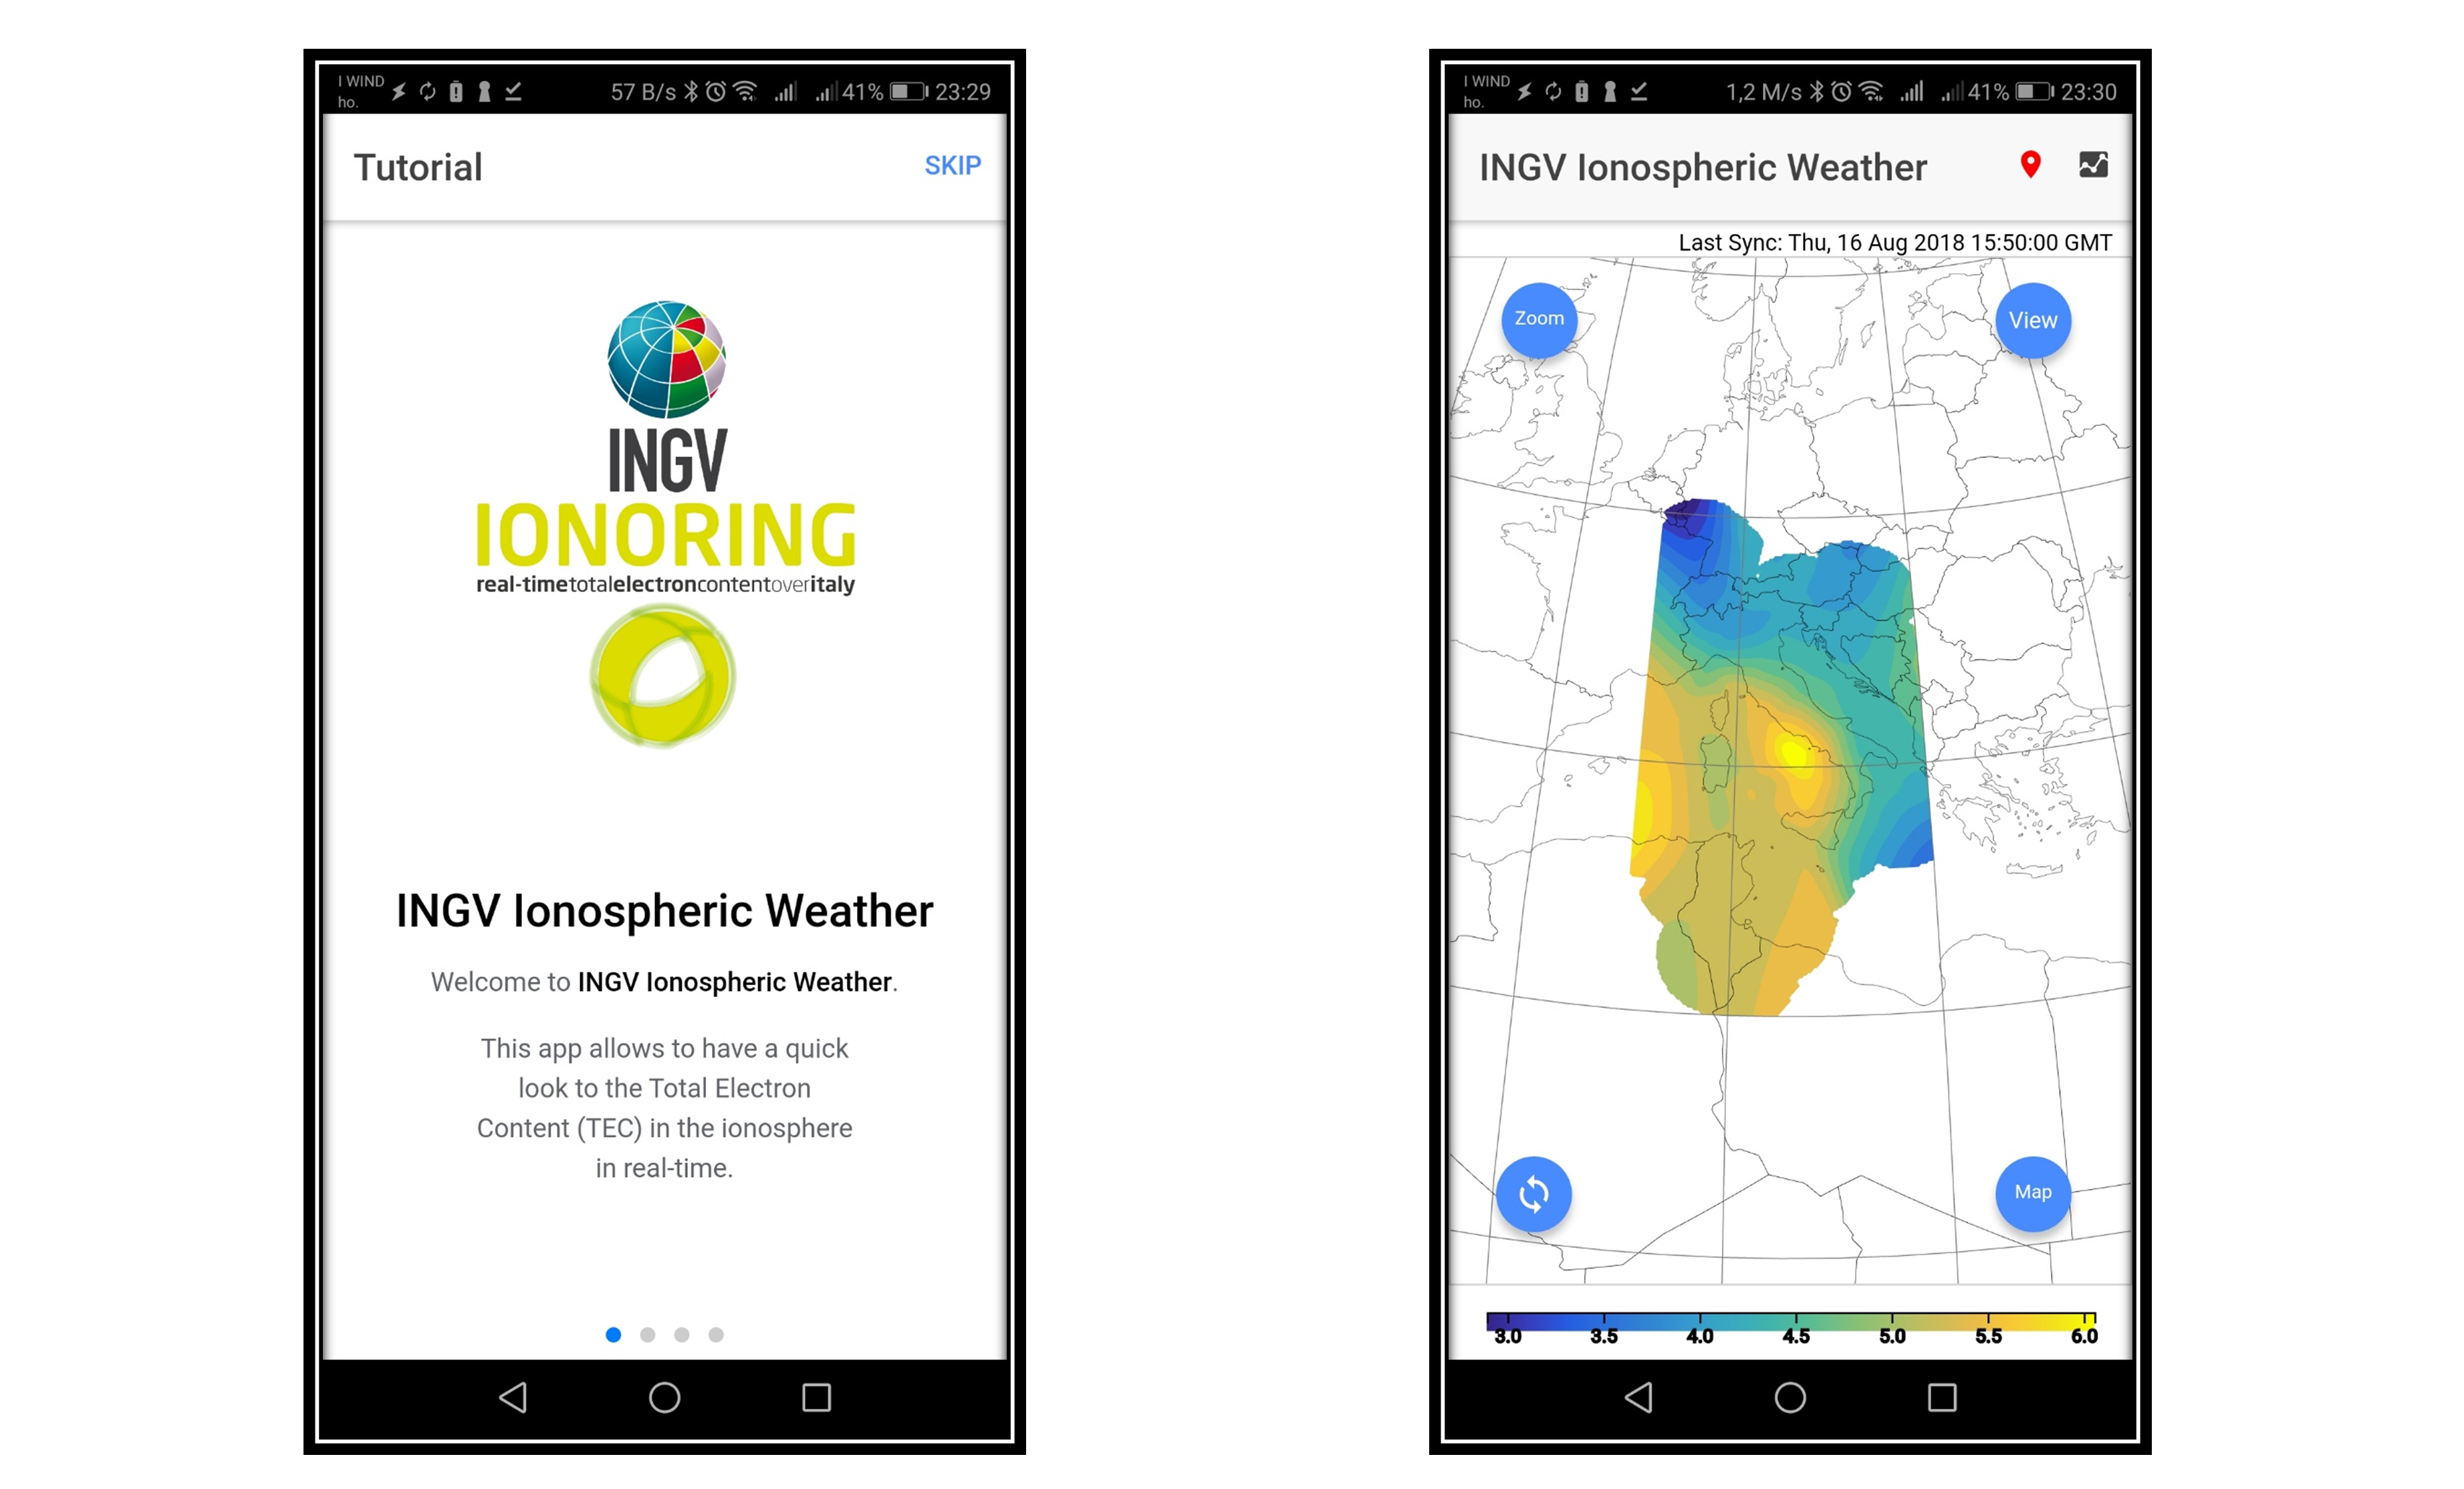
The main goal of the IONORING (IONOspheric RING) project is to exploit data from the RING (Rete Integrata Nazionale GPS) network to obtain ionospheric Total Electron Content (TEC) maps with very fine spatial resolution (0.1°x0.1°, lat x long). These maps will be useful to support ionospheric error mitigation in precise positioning and to study the ionosphere morphology and dynamics during strong solar and geomagnetic storms affecting the mid-latitude ionosphere. This page reports the TEC maps generated in real-time every 10 minutes collecting data from about 40 RING stations.
IONORING Android and iOS mobile app is coming soon. Stay tuned!

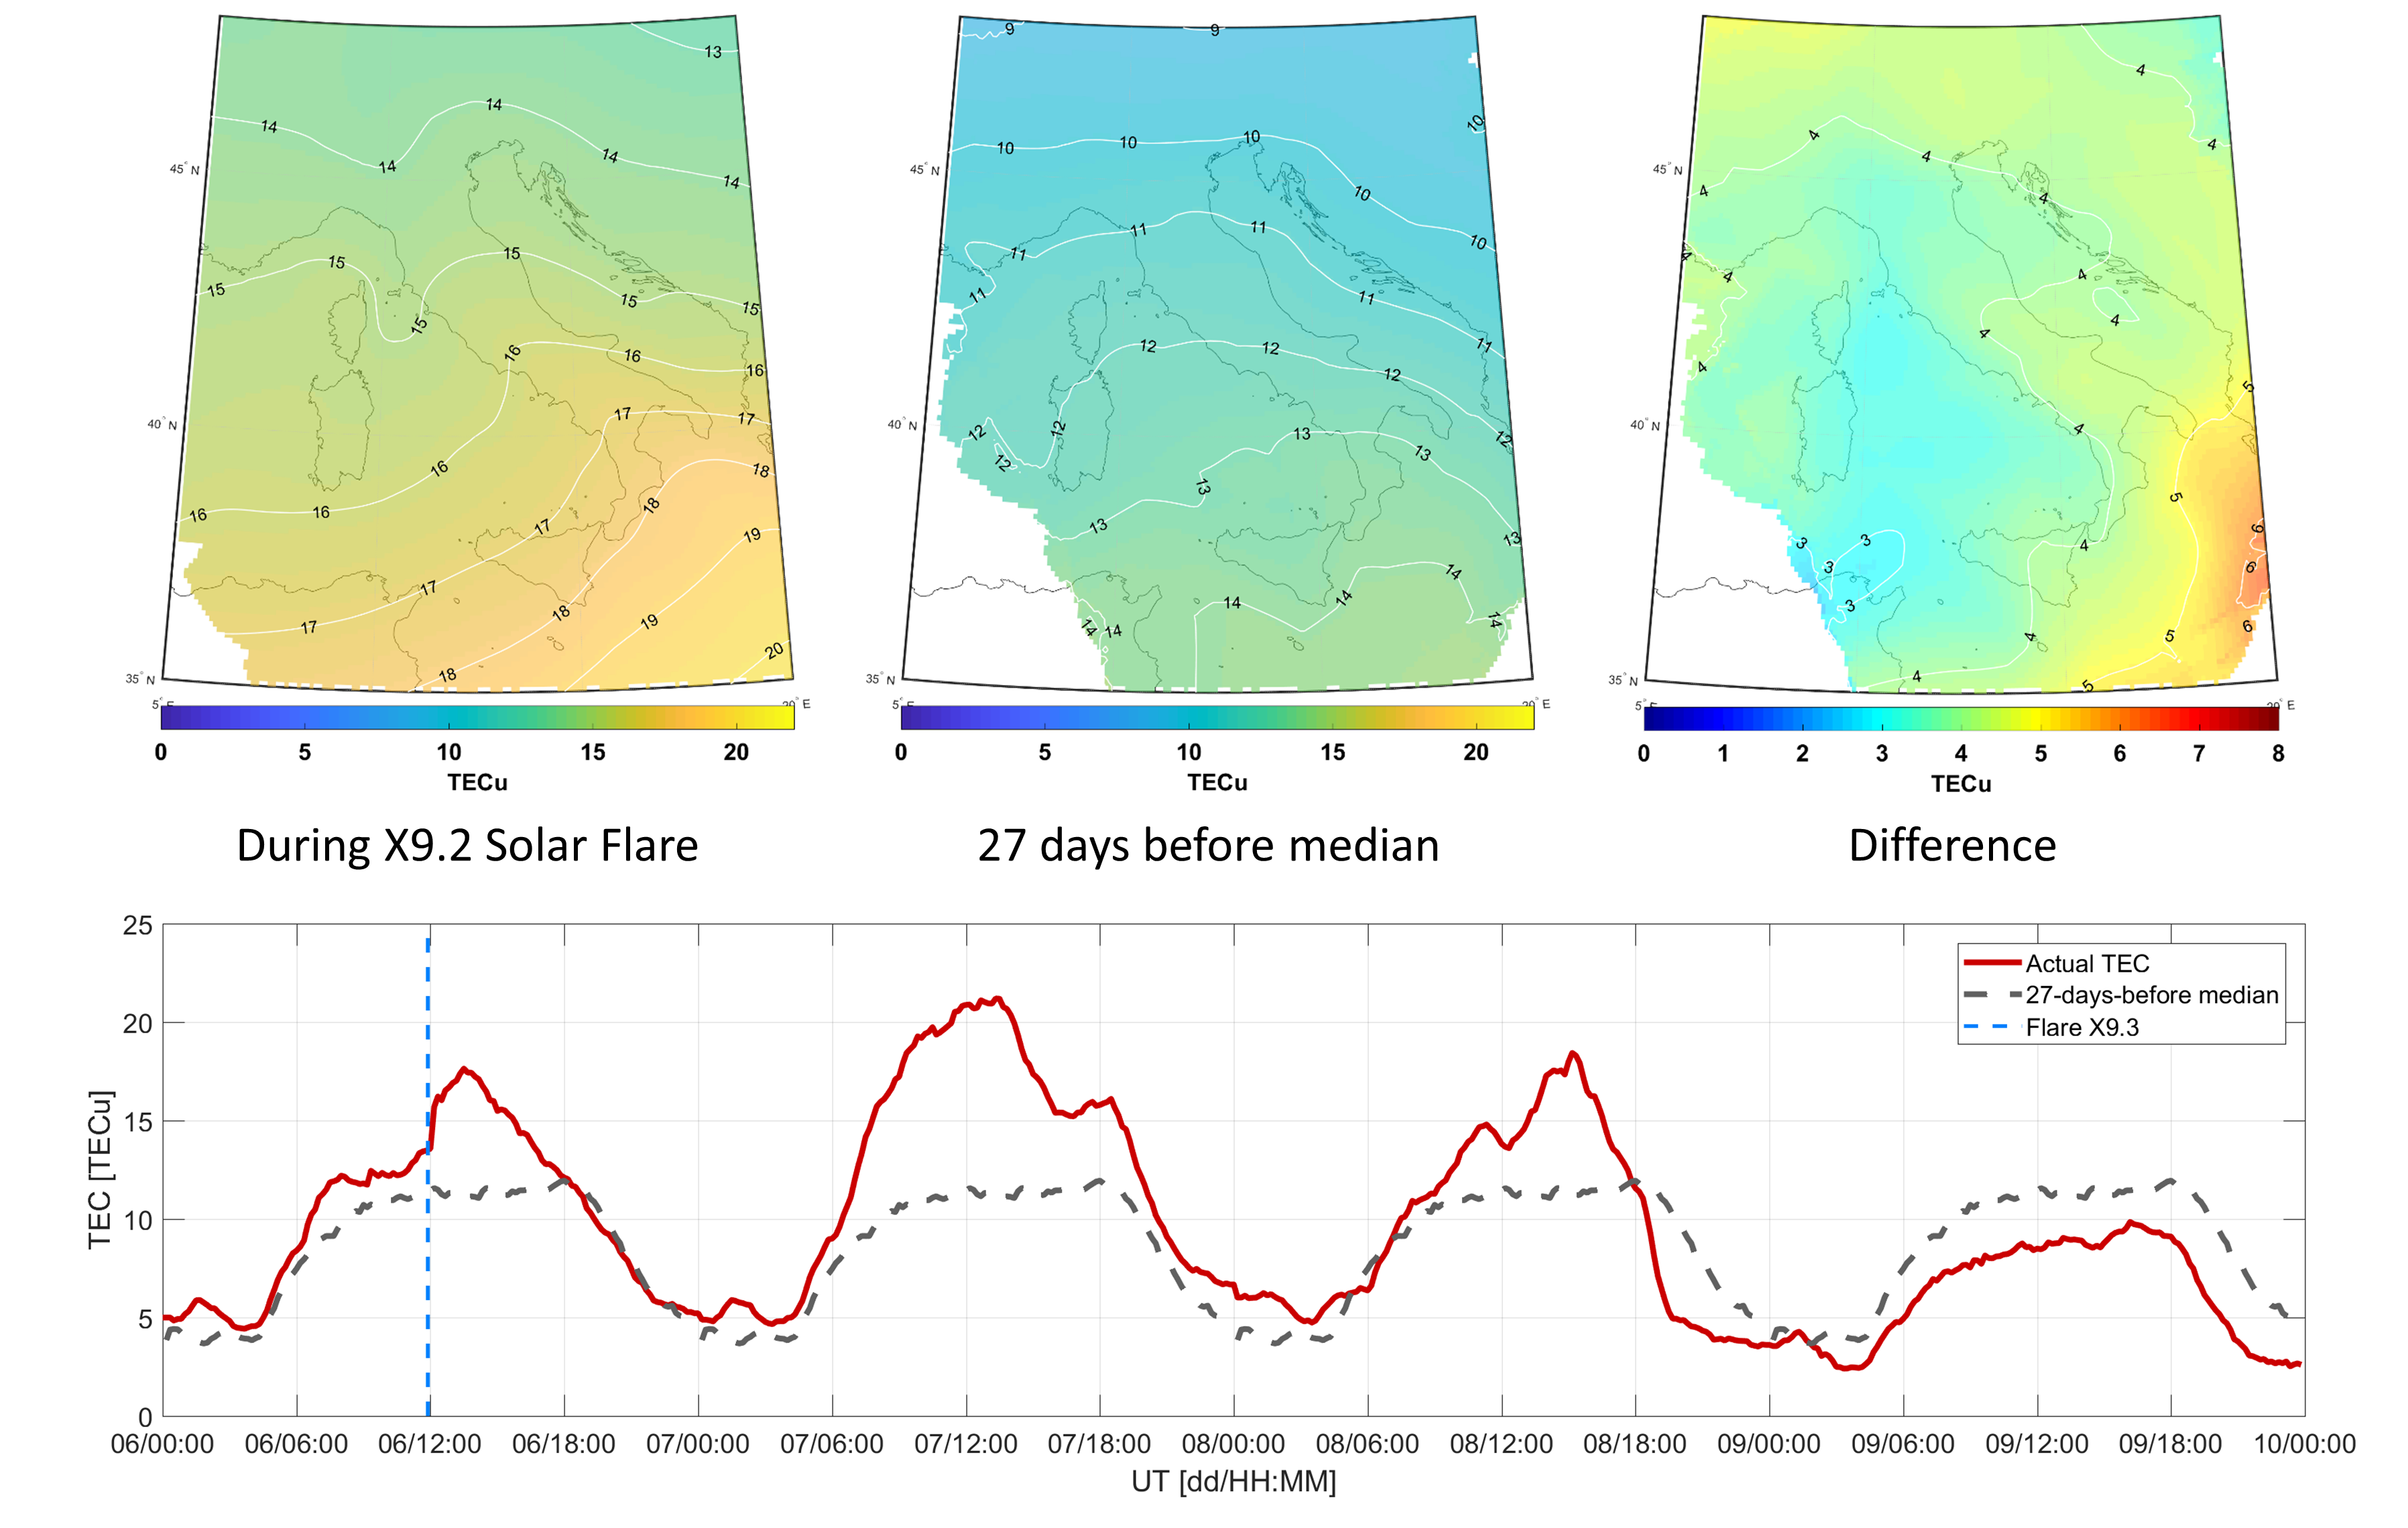
September 2017 seems to be one the most active month of the present solar cycle from flares point of view! Solar flares are huge emissions of radiation emitted by the Sun and which can hit the magnetospere-ionoshere system of our planet, causing an enhancement of ionospheric ionization. IONORING detected this enhancement caused by the X9.3 Solar Flare occurred on September 6th as shown in the upper-left panel of the figure below. Compared to the median values of TEC (Total Electron Content) recorded at the same hour of the 27 days before (middle panel), an increase of 4-6 TECu has been observed over Italy for that day. The behaviour of the ionospheric ionization is clear looking at the bottom graph showing the temporal evolution of the mean TEC compiled from 10-minute pictures over the whole map. In correspondance to the flare (blue vertical dashed line) the mean TEC value over Italy (red solid line) increased of more than 5 TECu with respect to the 27-day median value (black line), remaining at this higher level for the following two days.

Thanks to INGV graphic designers we've got our fantastic logo!

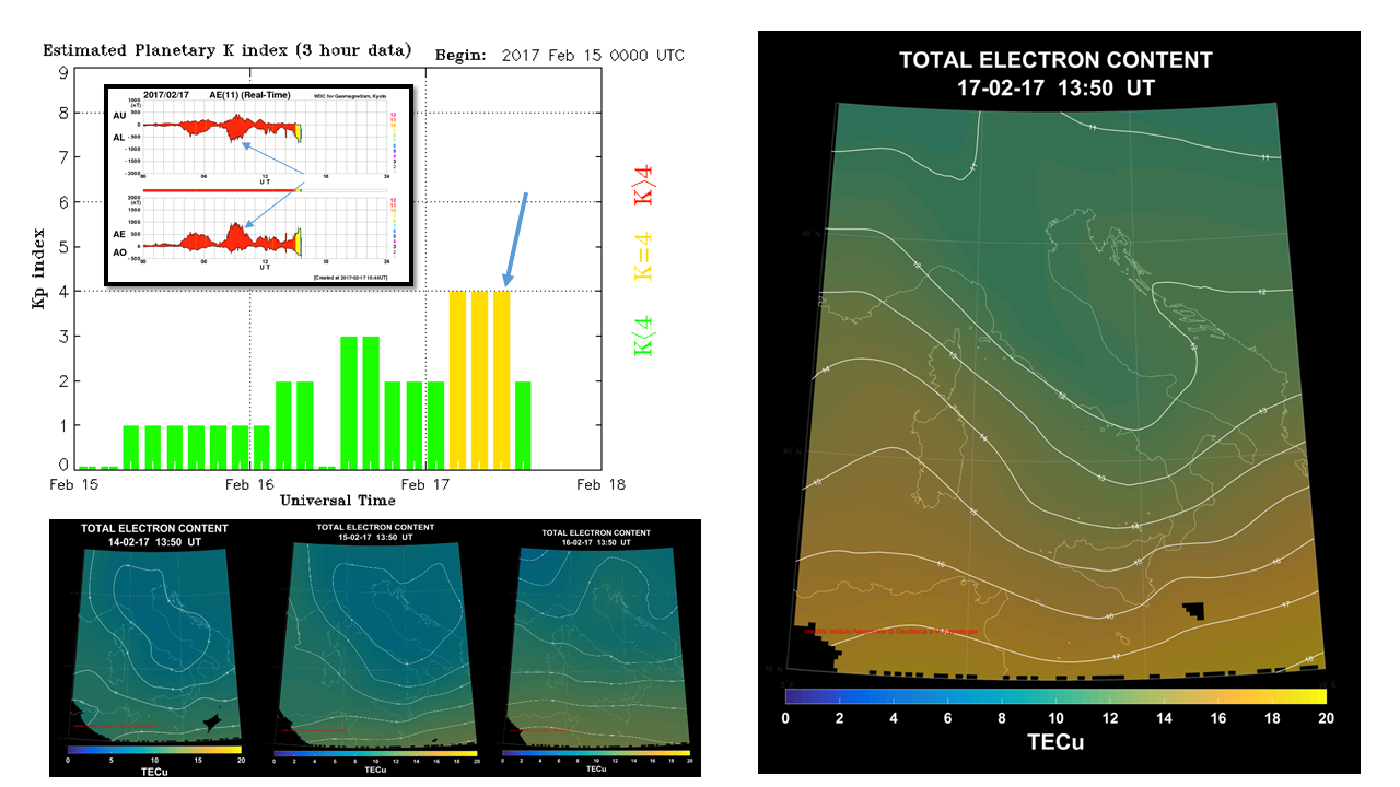
An unusual broad Coronal Hole (CH) appeared today on the southern hemisphere of the Sun atmosphere. The Solar Wind flowing from this CH is causing intermittent disturbances on the Earth's magnetic Field (see figure below, courtesy of NOAA-SWPC and Kyoto geomagnetic observatory). For more information on the ongoing geomagnetic storm see www.spaceweather.com Perturbations on the geomagnetic field can induce disturbances in the mid-latitude ionosphere causing an ehnancment or a decrease on the Total Electron Content. Today, real-ime maps provided by IONORING showed an higjer TEC (reaching about 20 TECu in the southern Italy) with respect to the previous days at the same hour as a signature of the geomagnetic storm.

Upper-left panel of the figure shows the behaviour of the planetary K index (Kp) and Auroral Electrojet index (AE) from which the evolution of the geomagnetic storm can be argued. Rigth panel reports the TEC maps on 17 February at 13:50 UT and the bottom-left panels represent the TEC maps at the same hour during 14, 15 and 16 February.
SHARE THIS PAGE!